The fleet management system is a common word for all fleet managers. The various advanced features of this system are useful to eliminate fleet problems. Trakzee is unique among them as it provides features like ADAS, OBD, TPMS, Digital Tachograph and Fleet immobilization. Trakzee platform looks after the needs of its customers in managing their fleet. We understand that fleet management is not only about real-time data and analysis but also needs history comparison.
The history of the fleet helps to understand the problems caused during its previous trips. This allows you to overcome the problems in upcoming trips. Our platform has the “Show History” option. Show history focuses on showing you all the activities of the selected vehicle during previous trips. It consists of a playback screen which provides history playback and fleet details which includes speed, fuel, TPMS, alerts and more.
In our previous blog, we informed you about its update in the blog “Trip Bifurcation in Playback Screen”. Today, we will discuss how can you get the best out of our playback screen.
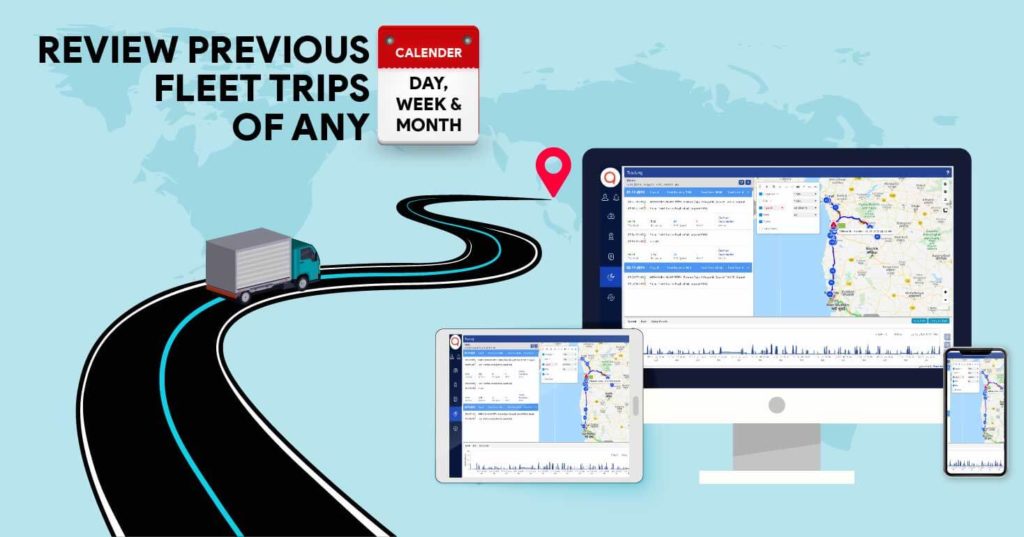
Select a time period to take a ride in the previous trips of your vehicle. You can choose today, yesterday, this or last week, this or last month, or you can create your range of dates to review the history.
Get to know the Playback screen…..
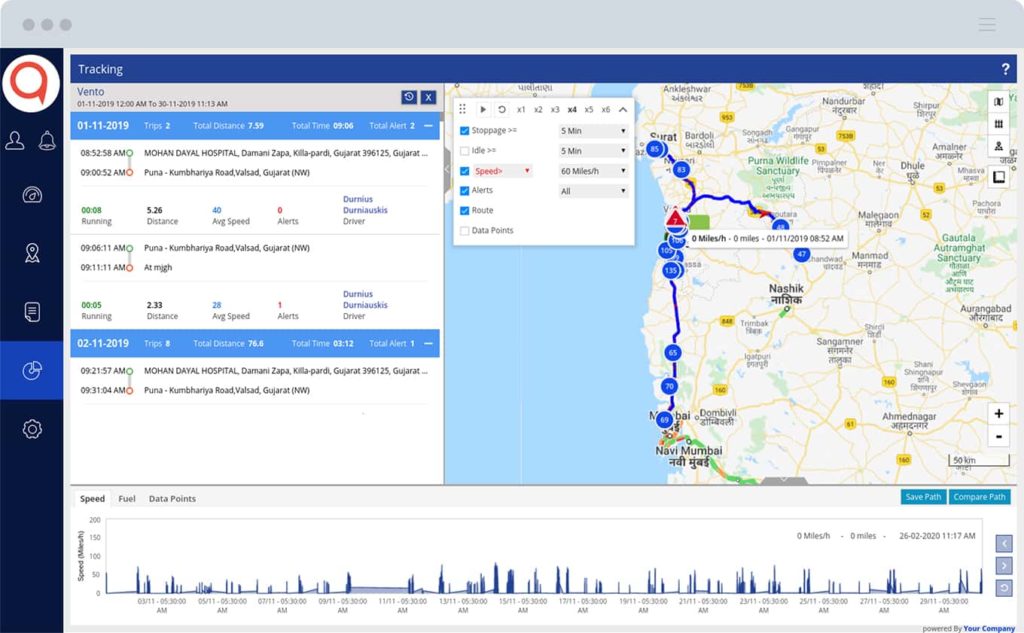
The screen is divided into three parts which are trip bifurcation, map and playback window. It means you have detail, route and graph. Get all the required information on vehicle travel history on the same screen.
Trip Bifurcation
It can be considered a detailed report of the previous trip. Here, you will get to know the location, travel distance, speed, alert and the driver which provides visibility for each date.
As shown in the image, the green colour indicates the location where the trip began and the red colour indicates the end location. By clicking on them, you can view the start and endpoints on the map.
Playback window
Below trip, bifurcation is the playback window. Here you can view the graph, get details and have control over the map.
Graphs with date and time are available, which can be easily viewed with the help of the playback button.
On the top right of the playback window is the “Save” option which will save the route’s current route for future comparison. Near this is a “Compare” option which enables you to compare your previously saved route with the selected route.
This means the playback window helps to control the data of the vehicle’s previous trip.
Map View
The map shows the route along with different data points. View different types of the map with routes and important detail. The route gives a clear view of the path taken by your vehicle and shows the activities that occurred.
The map highlights alerts, speed, idle point, stoppage and data points with various symbols and colours as shown in the video. If you want to get the details of any activity, then click on the point on the map. Thus you get efficient data as if you are tracking the vehicle in real-time.
Select the points and adjust the playback speed according to your requirement. This helps you to see your requirements on the map. For example, if you uncheck the alert, then you won’t be able to view alerts on the map. If you select speed as 20 miles/hr, then the map will show the area in red colour for your understanding.
Closure
The growth of a business depends on the future results of historical analysis. Monitor your fleet’s current performance, evaluate the previous trips and take steps for a successful future. Be connected with us to know about amazing fleet management features and know upcoming technology.